Publicação Fixada
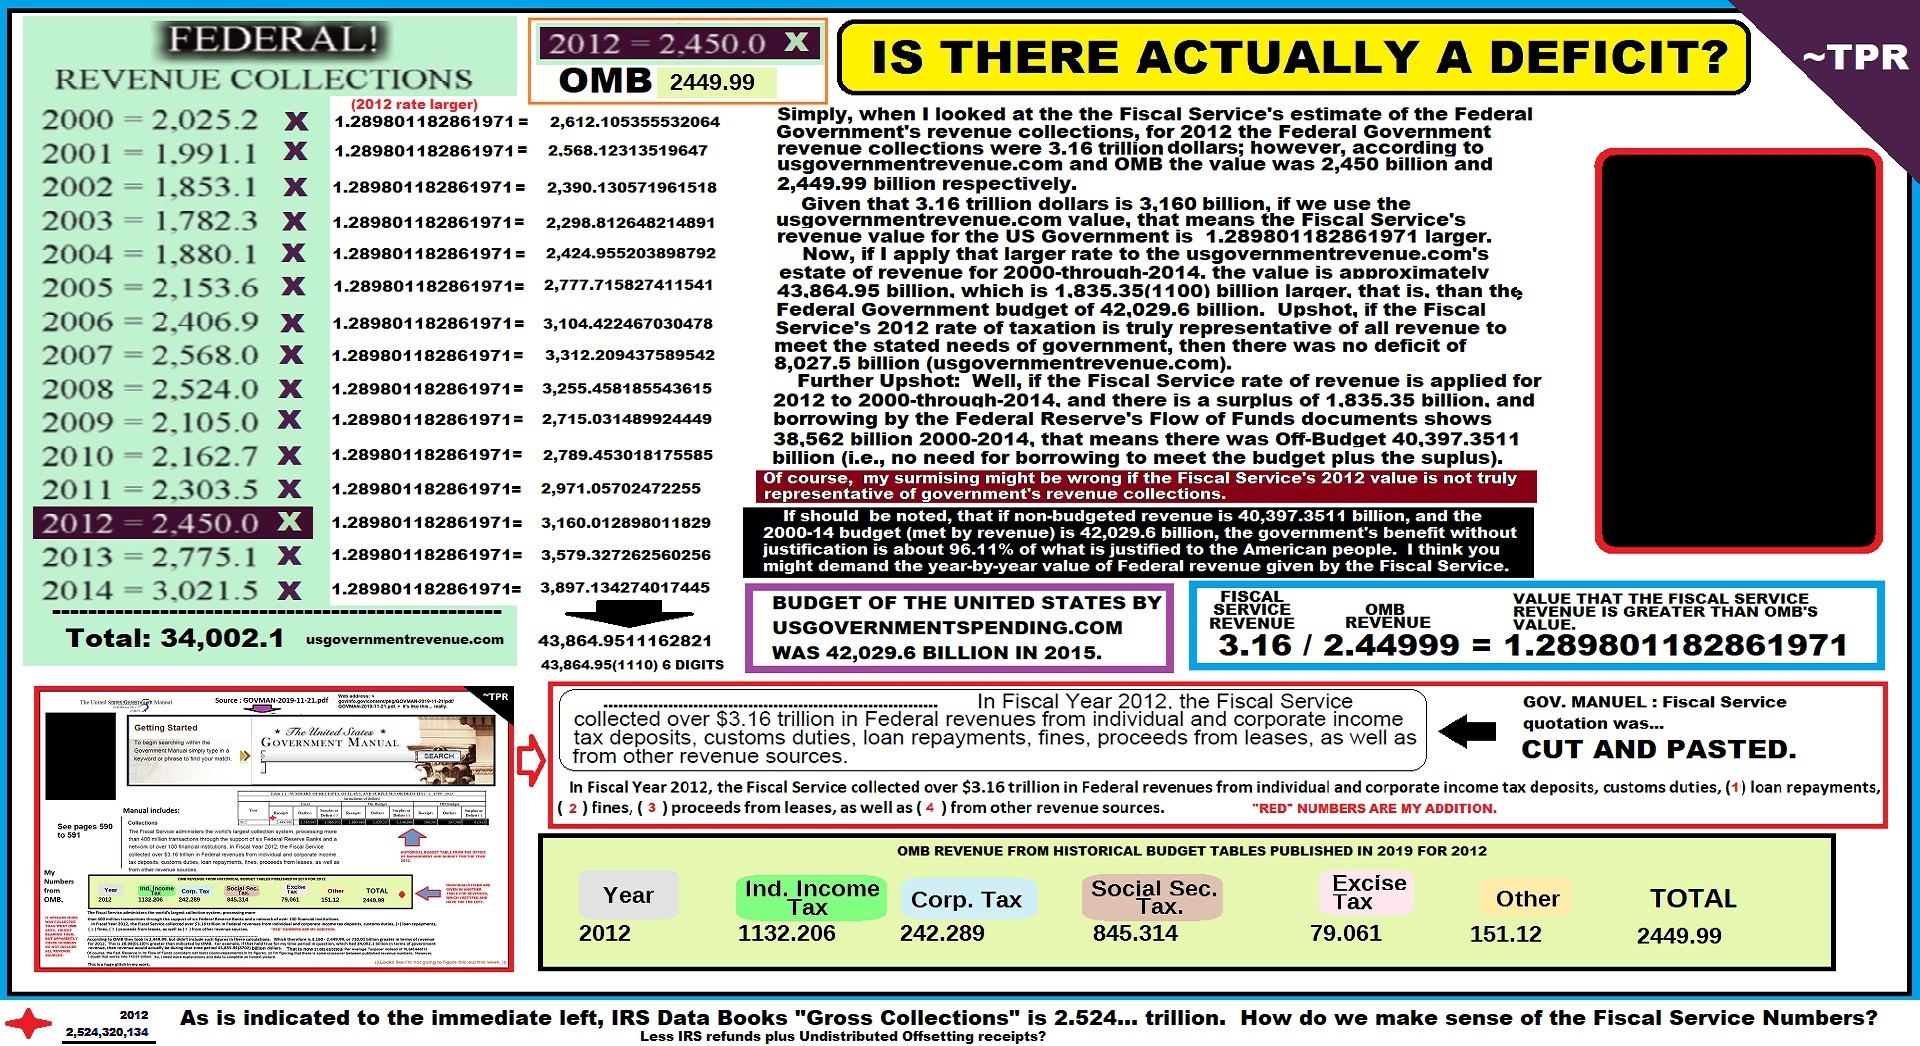
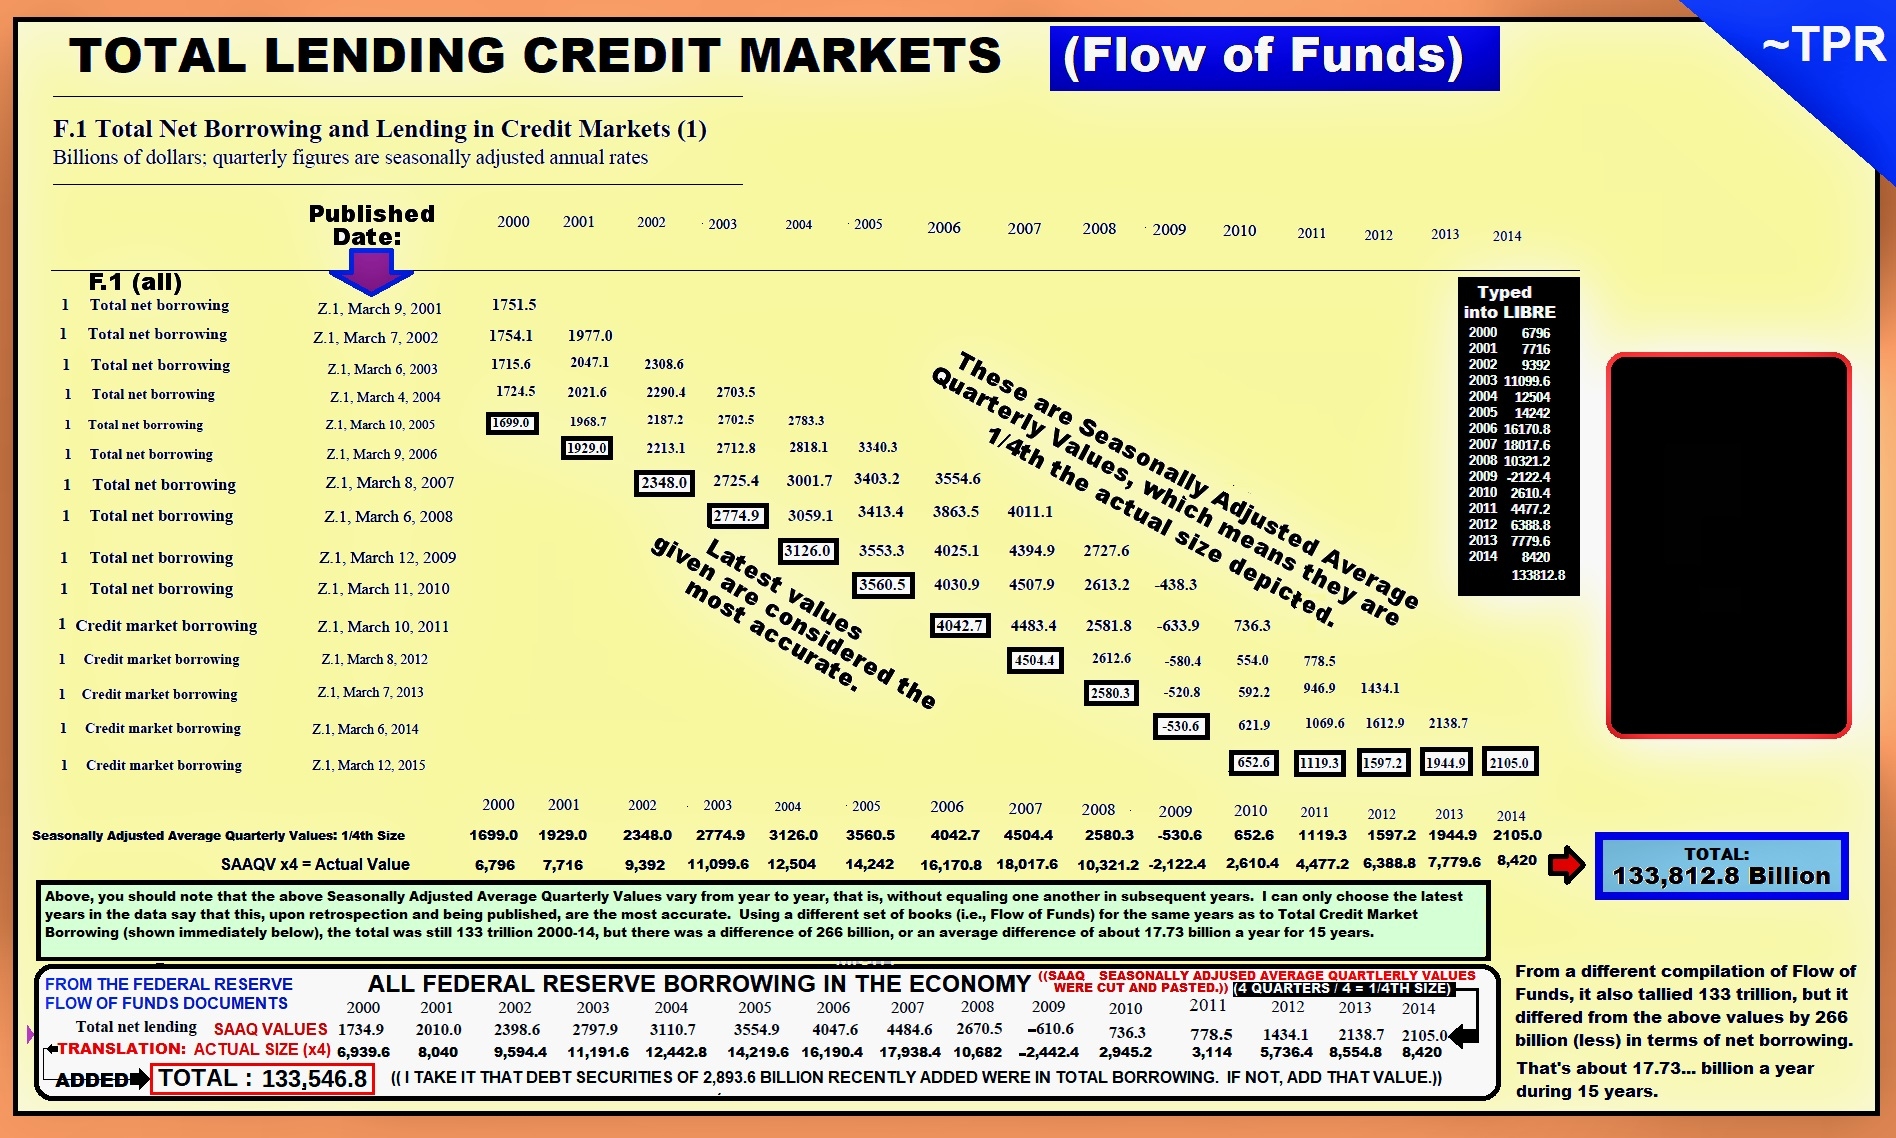
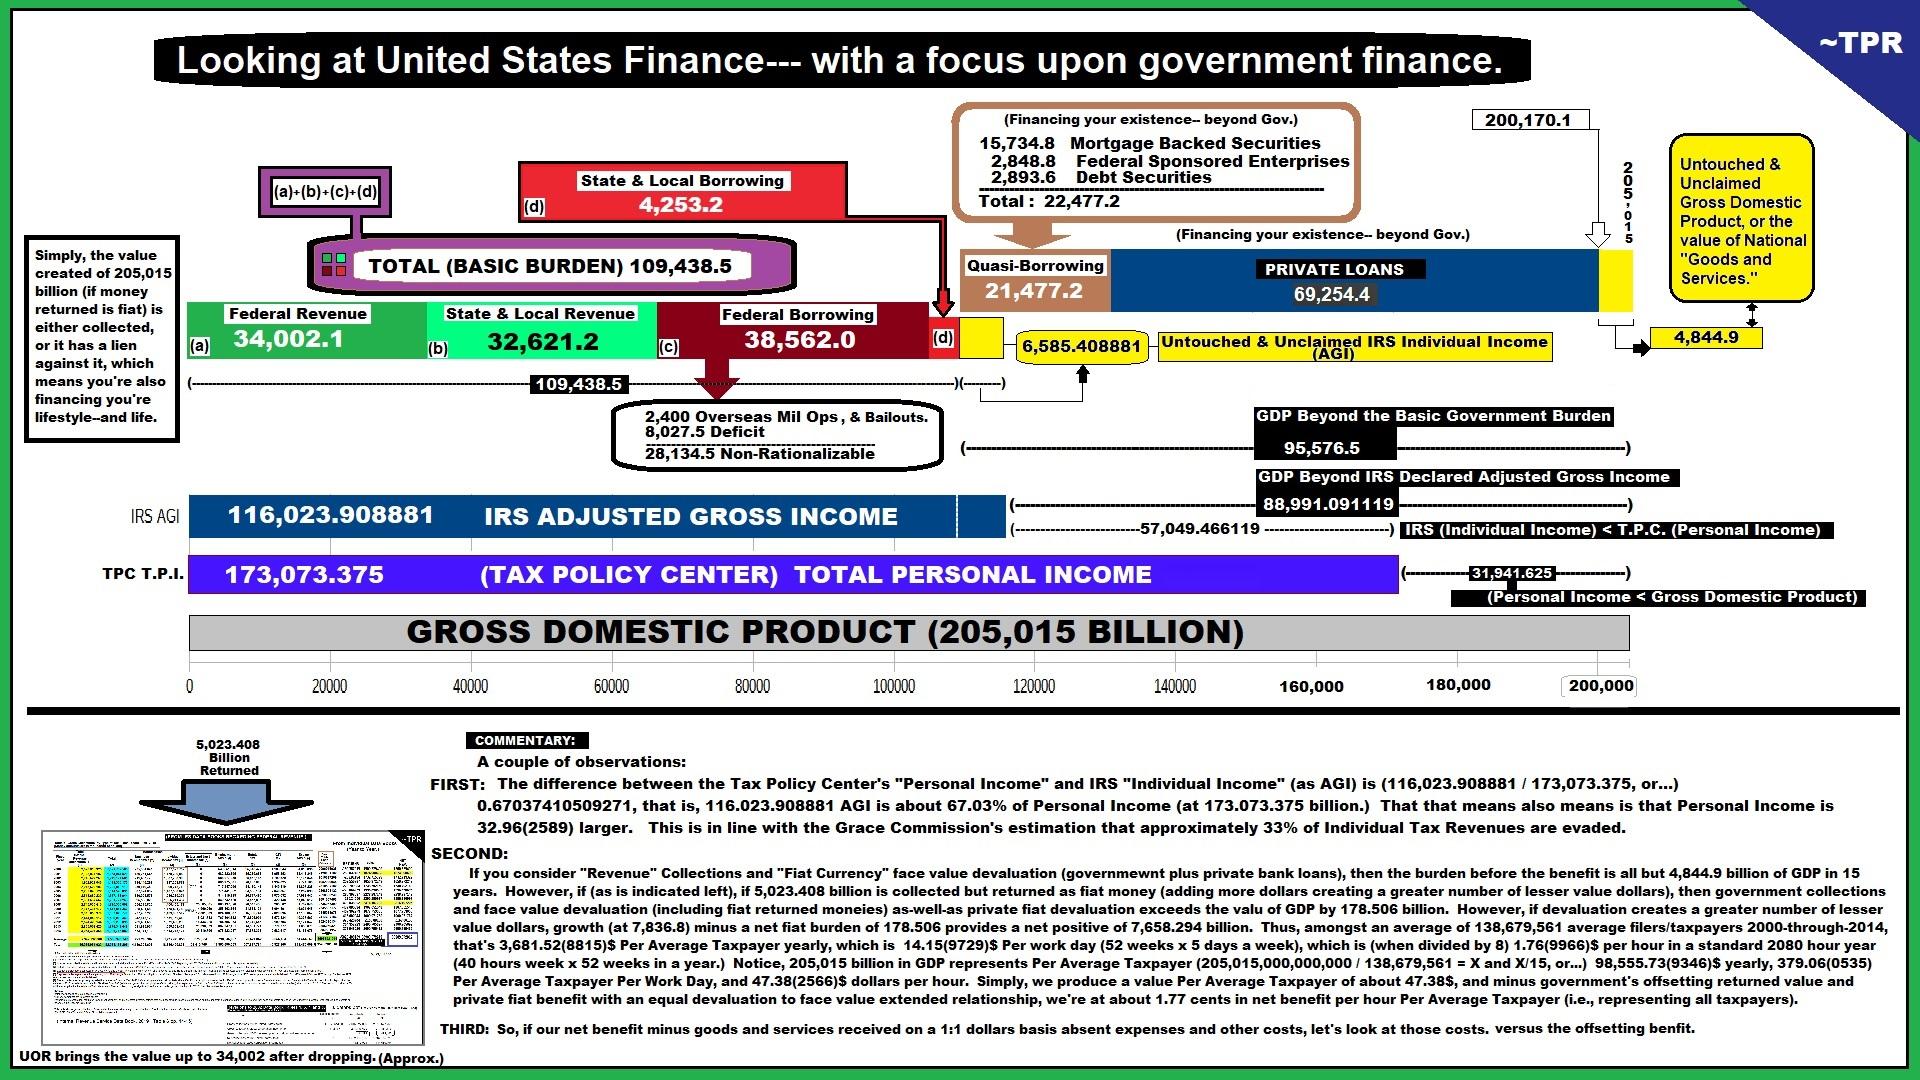
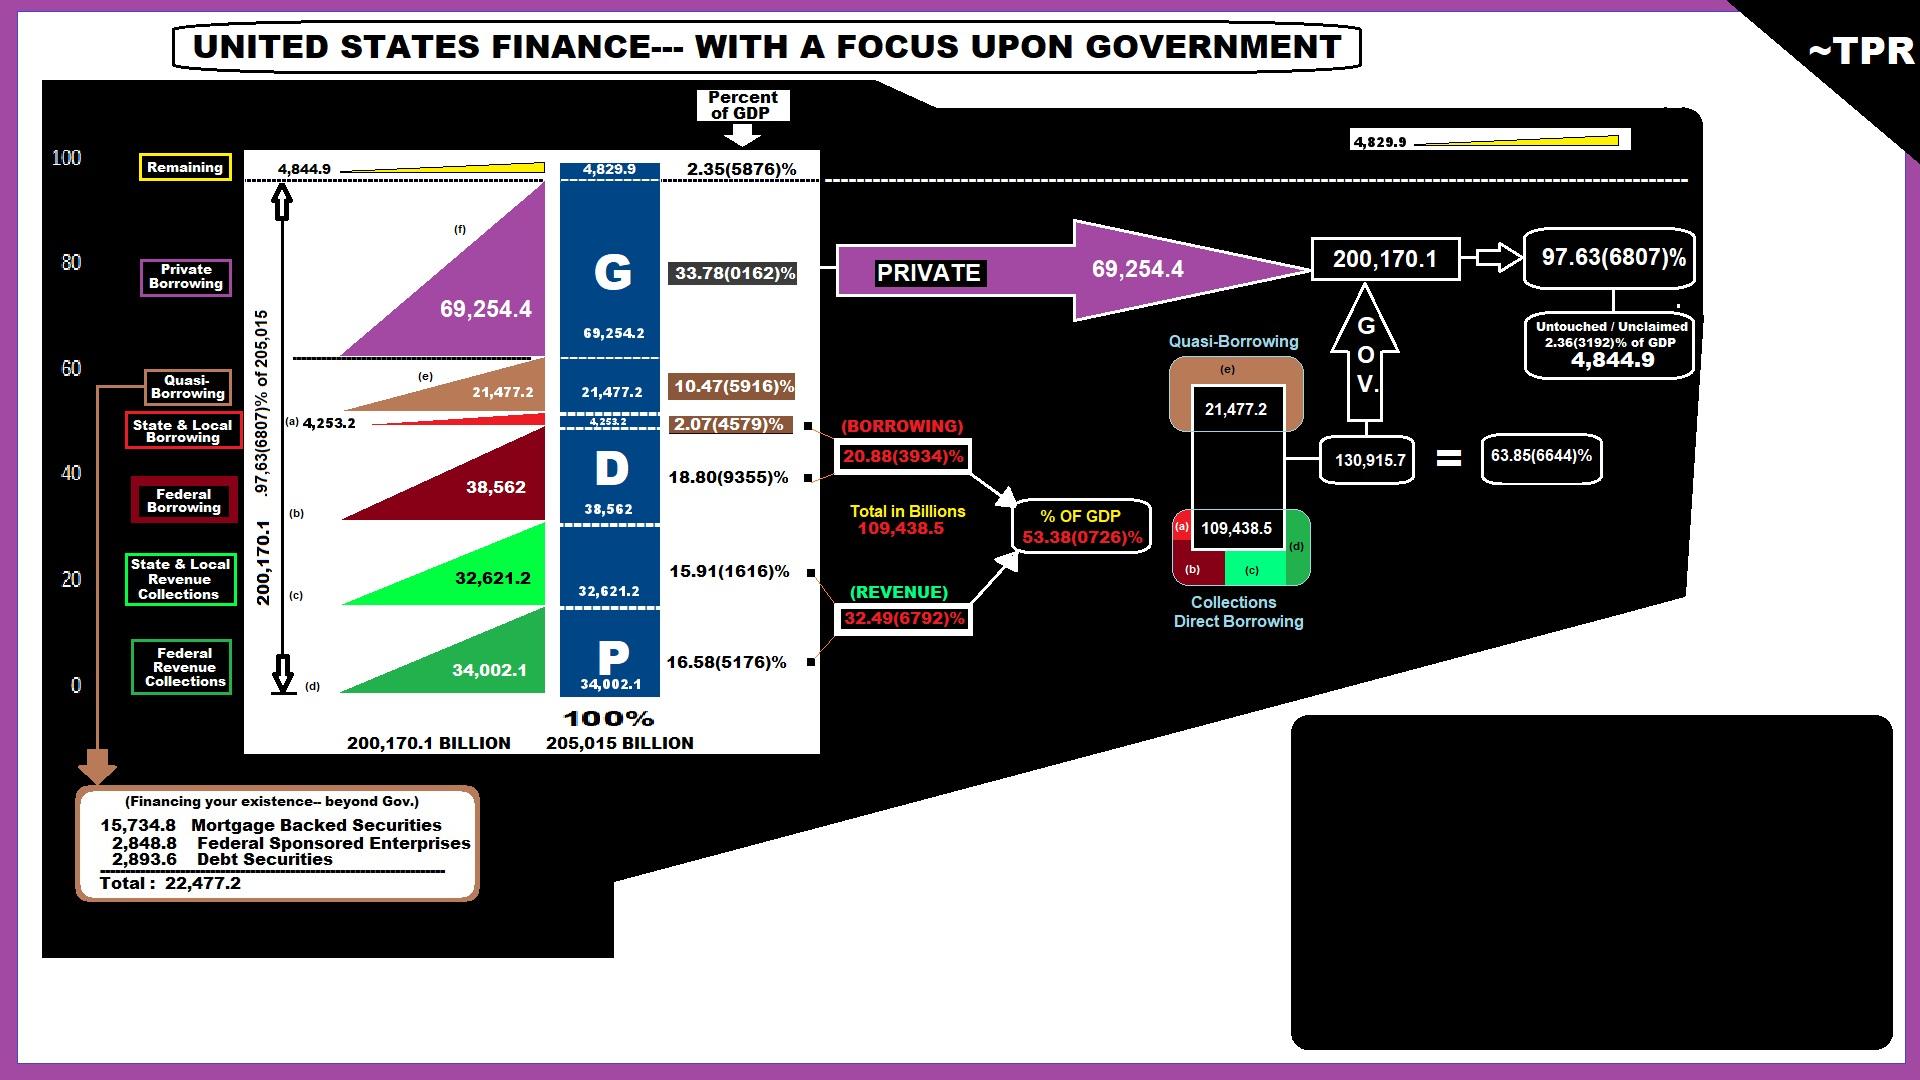
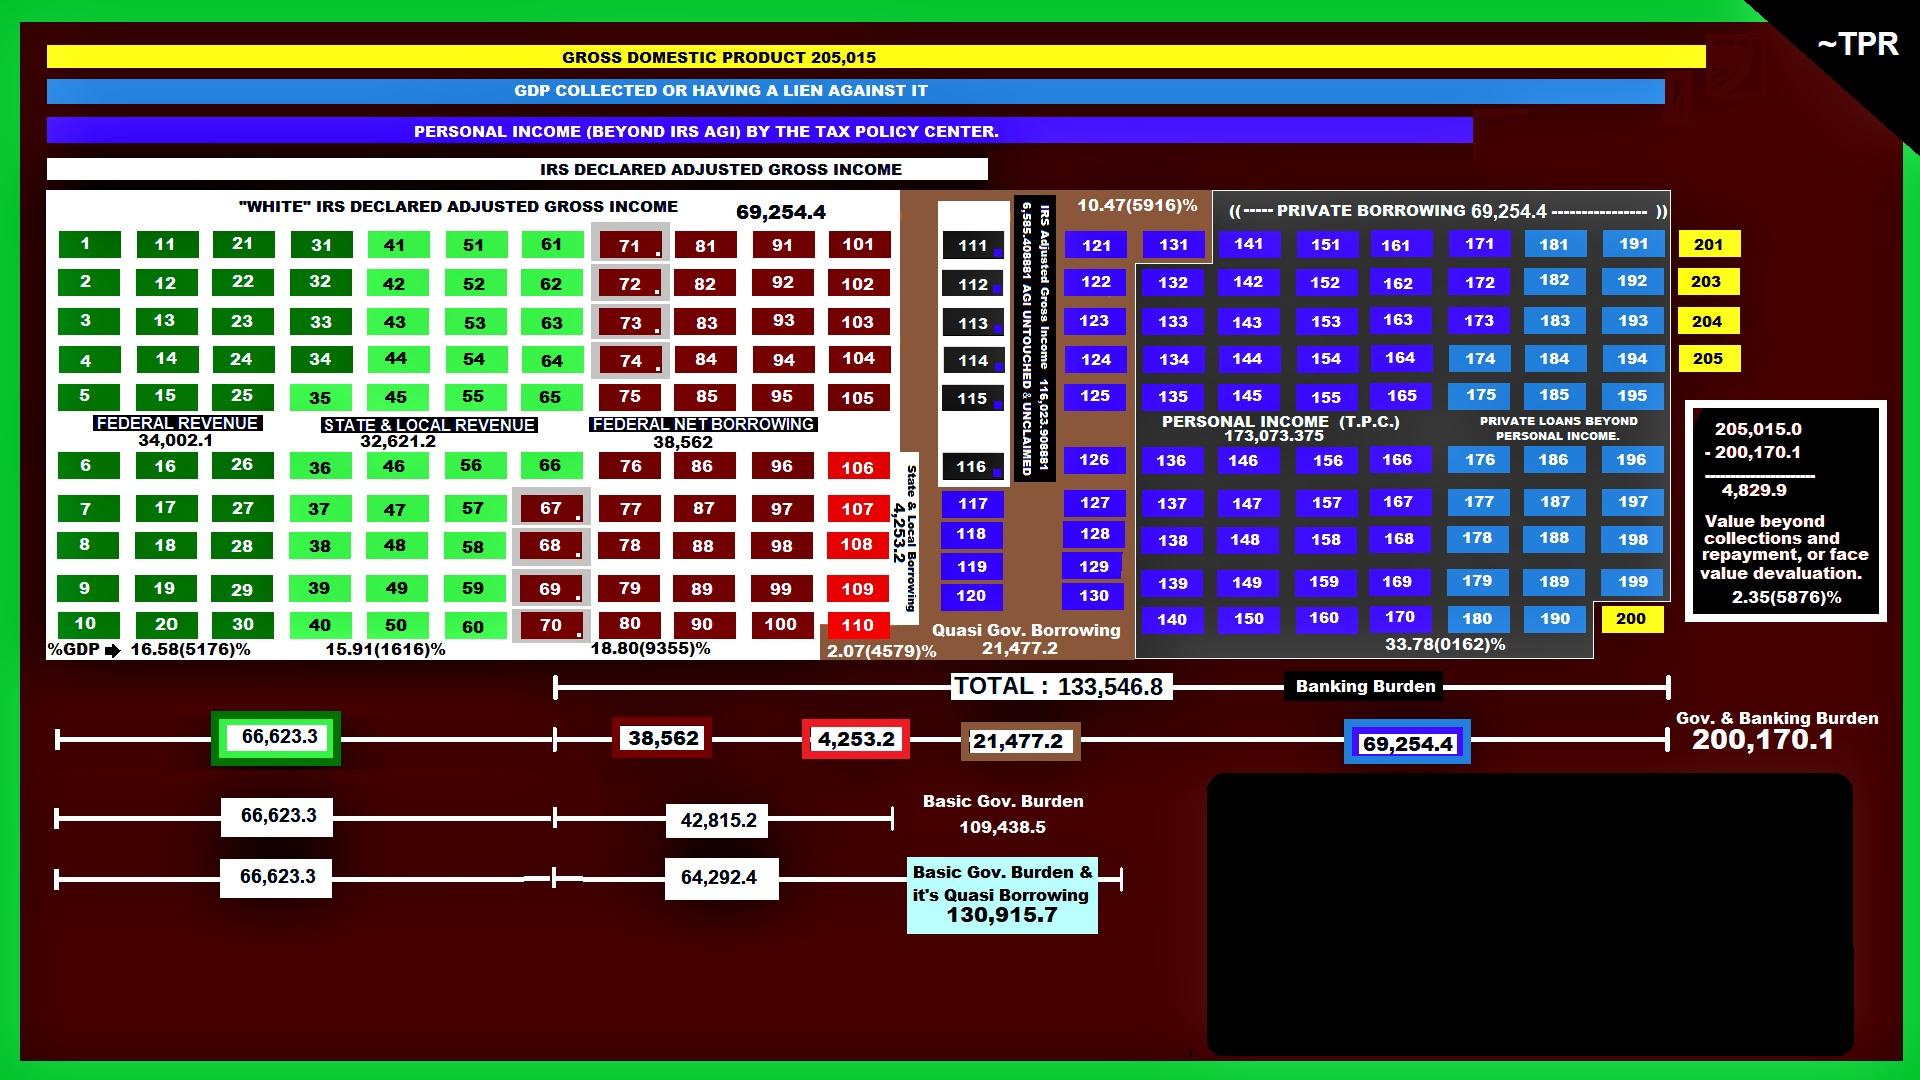
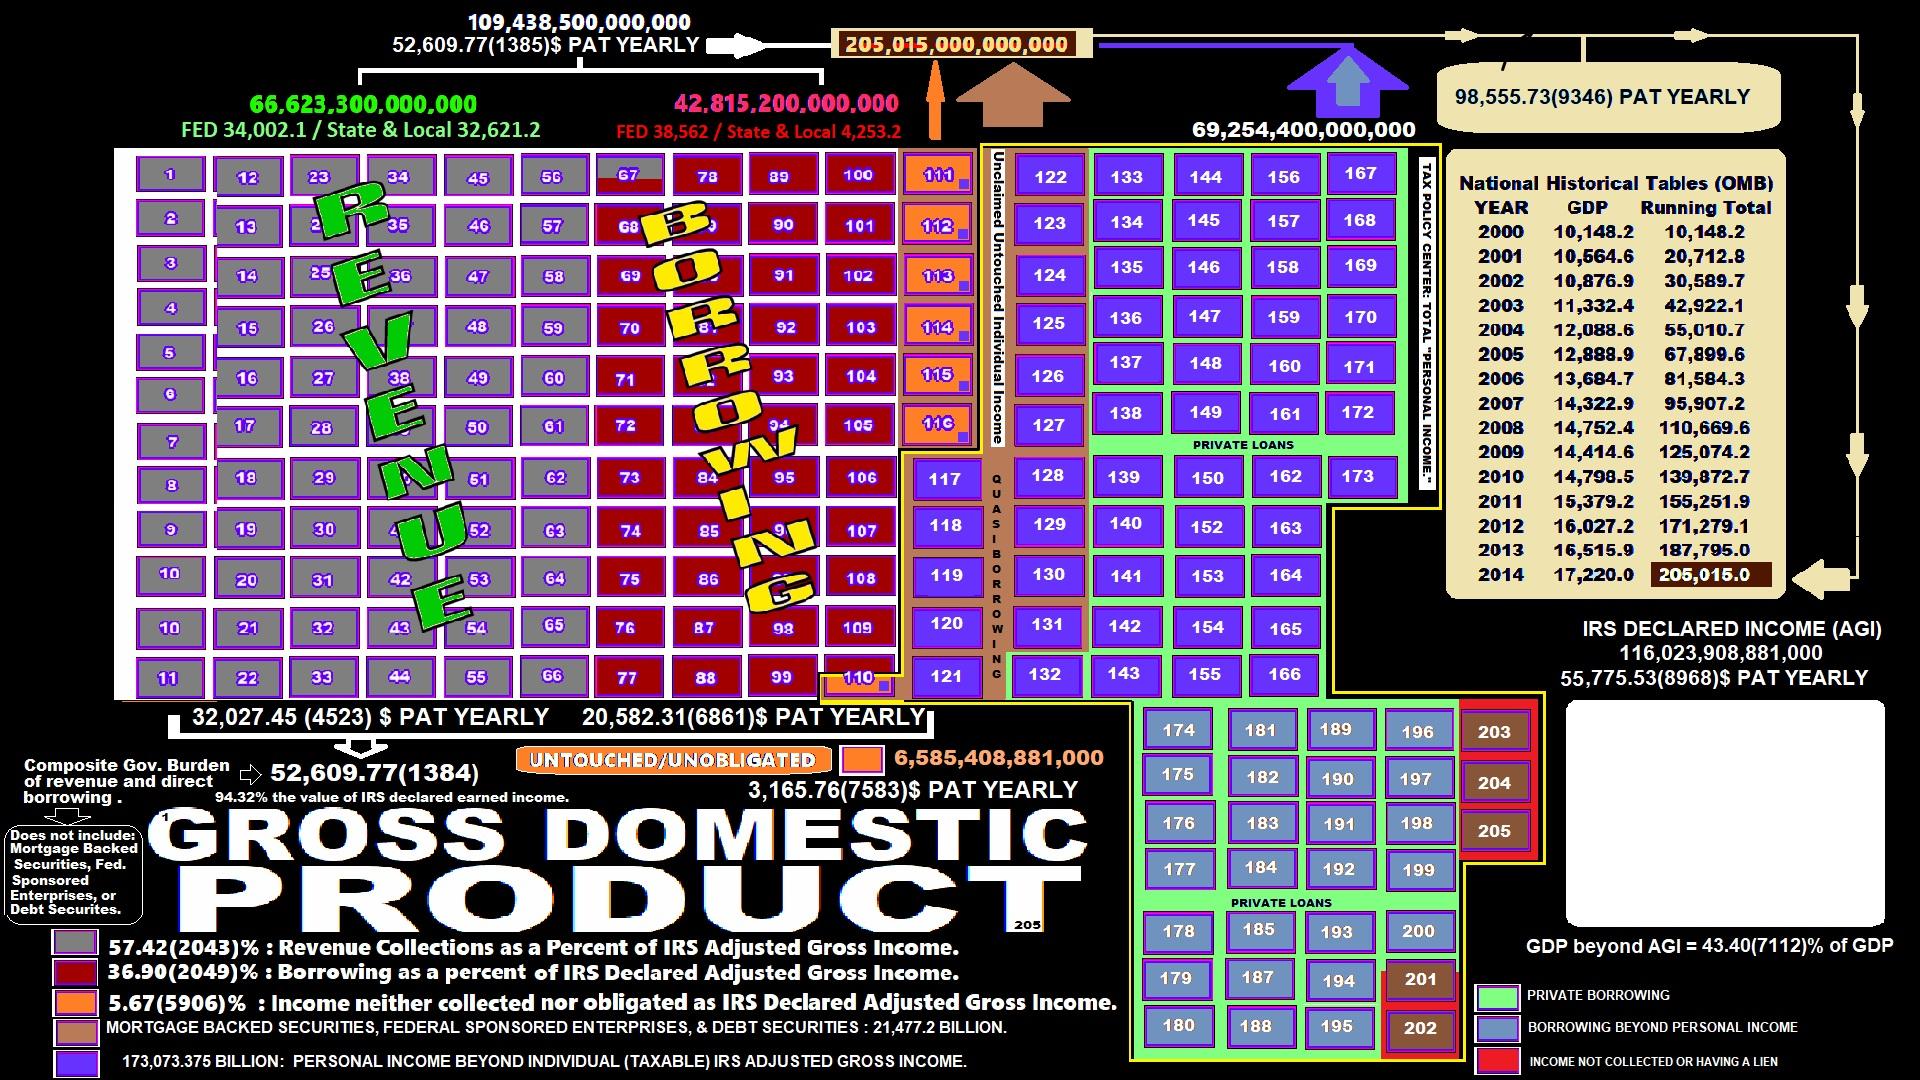
See the graphics to the right / pictures. Those pictures detail important government financial information between the years 2000 through 2014 (i.e., 15 years).
1 Comentários 0 Compartilhamentos 391 Visualizações
Atualizações Recentes
  • The Fiscal Service has Federal revenue at 1.28% larger than OMB in 2012. If we apply that rate to 2000-14, there is no deficit. If we subtract 5,023 billion for returned monies (aka tax rebate), the deficit is much smaller--about 1/2 2000-14. So, what actually are our Federal Revenues? How much did they actually need: the deficit? I find this an interesting question.
    The Fiscal Service has Federal revenue at 1.28% larger than OMB in 2012. If we apply that rate to 2000-14, there is no deficit. If we subtract 5,023 billion for returned monies (aka tax rebate), the deficit is much smaller--about 1/2 2000-14. So, what actually are our Federal Revenues? How much did they actually need: the deficit? I find this an interesting question.
    1 Comentários 0 Compartilhamentos 2K Visualizações
  • Notice: Between the years 2000-14, total net borrowing, which is to day new debt (absent any type of forgiveness) is over 133 trillion. However, officially declared IRS Adjusted Gross Income was approximately 116 trillion. Even if you subtract growth in the economy from face value devaluation from such said loans, you end up with NO OVERALL SAVINGS, for there is a lien against all IRS declared income. I consider CAPITALISM to engender savings invested/reinvested absent a third party with their own interest/influence/concurrence in economic decisions. In net terms, we do not have savings and thus Capitalism in America 2000-14. I'd guess the pattern hasn't changed.
    Notice: Between the years 2000-14, total net borrowing, which is to day new debt (absent any type of forgiveness) is over 133 trillion. However, officially declared IRS Adjusted Gross Income was approximately 116 trillion. Even if you subtract growth in the economy from face value devaluation from such said loans, you end up with NO OVERALL SAVINGS, for there is a lien against all IRS declared income. I consider CAPITALISM to engender savings invested/reinvested absent a third party with their own interest/influence/concurrence in economic decisions. In net terms, we do not have savings and thus Capitalism in America 2000-14. I'd guess the pattern hasn't changed.
    0 Comentários 0 Compartilhamentos 2K Visualizações
  • Just hanging out in lovely Massachusetts. The torture is free. :-)
    Just hanging out in lovely Massachusetts. The torture is free. :-)
    0 Comentários 0 Compartilhamentos 2K Visualizações
  • Well, it finally looks like my politichatter.com site info has been hacked--expectedly. The site can be no longer contacted as secure. I just find this interesting.
    Well, it finally looks like my politichatter.com site info has been hacked--expectedly. The site can be no longer contacted as secure. I just find this interesting.
    0 Comentários 0 Compartilhamentos 2K Visualizações
  • ANOTHER OVERVIEW
    ANOTHER OVERVIEW
    0 Comentários 0 Compartilhamentos 2K Visualizações
  • OVERALL FINANCE TO CONTEMPLATE 1
    OVERALL FINANCE TO CONTEMPLATE 1
    0 Comentários 0 Compartilhamentos 2K Visualizações
  • OVERALL FINANCE TO CONTEMPLATE 2
    OVERALL FINANCE TO CONTEMPLATE 2
    0 Comentários 0 Compartilhamentos 2K Visualizações
  • OVERALL FINANCE TO CONTEMPLATE 3
    OVERALL FINANCE TO CONTEMPLATE 3
    0 Comentários 0 Compartilhamentos 2K Visualizações
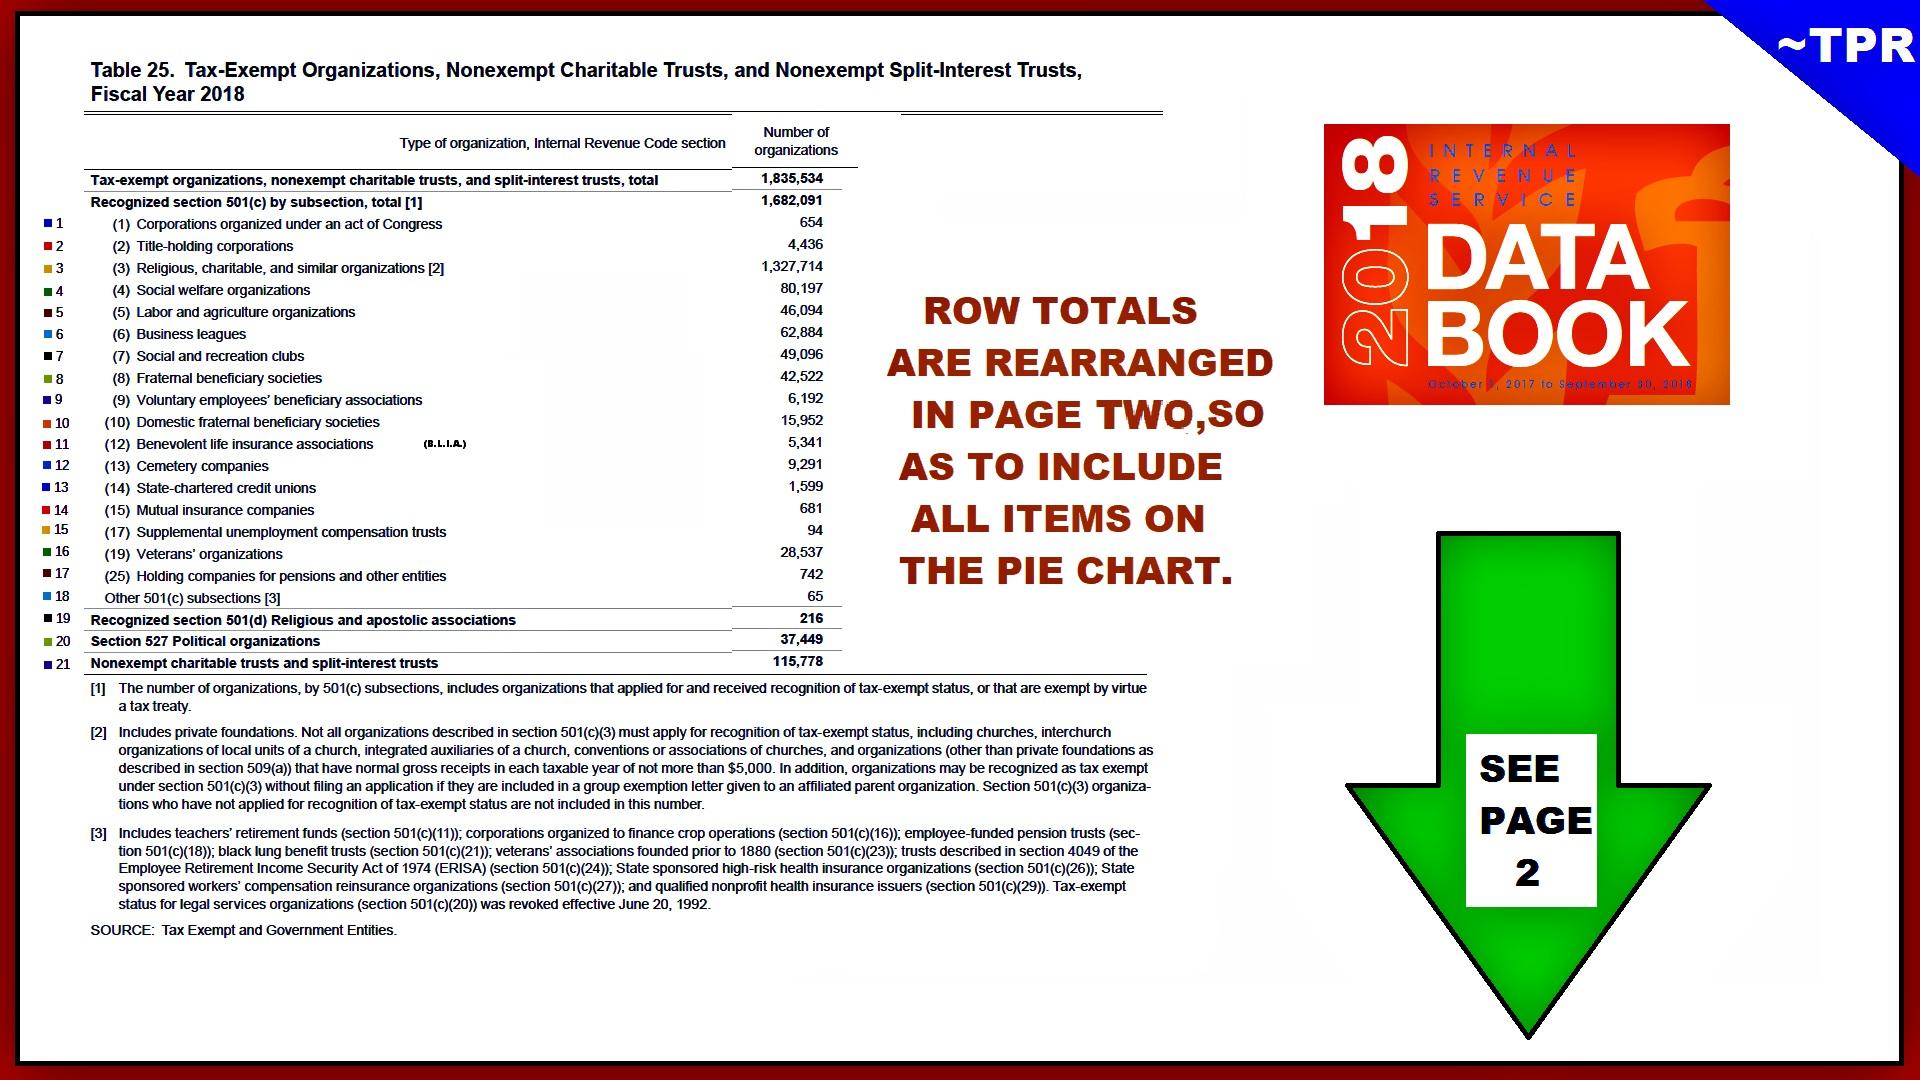
  • TAX EXEMPT ORGANIZATIONS PART 1
    TAX EXEMPT ORGANIZATIONS PART 1
    0 Comentários 0 Compartilhamentos 2K Visualizações
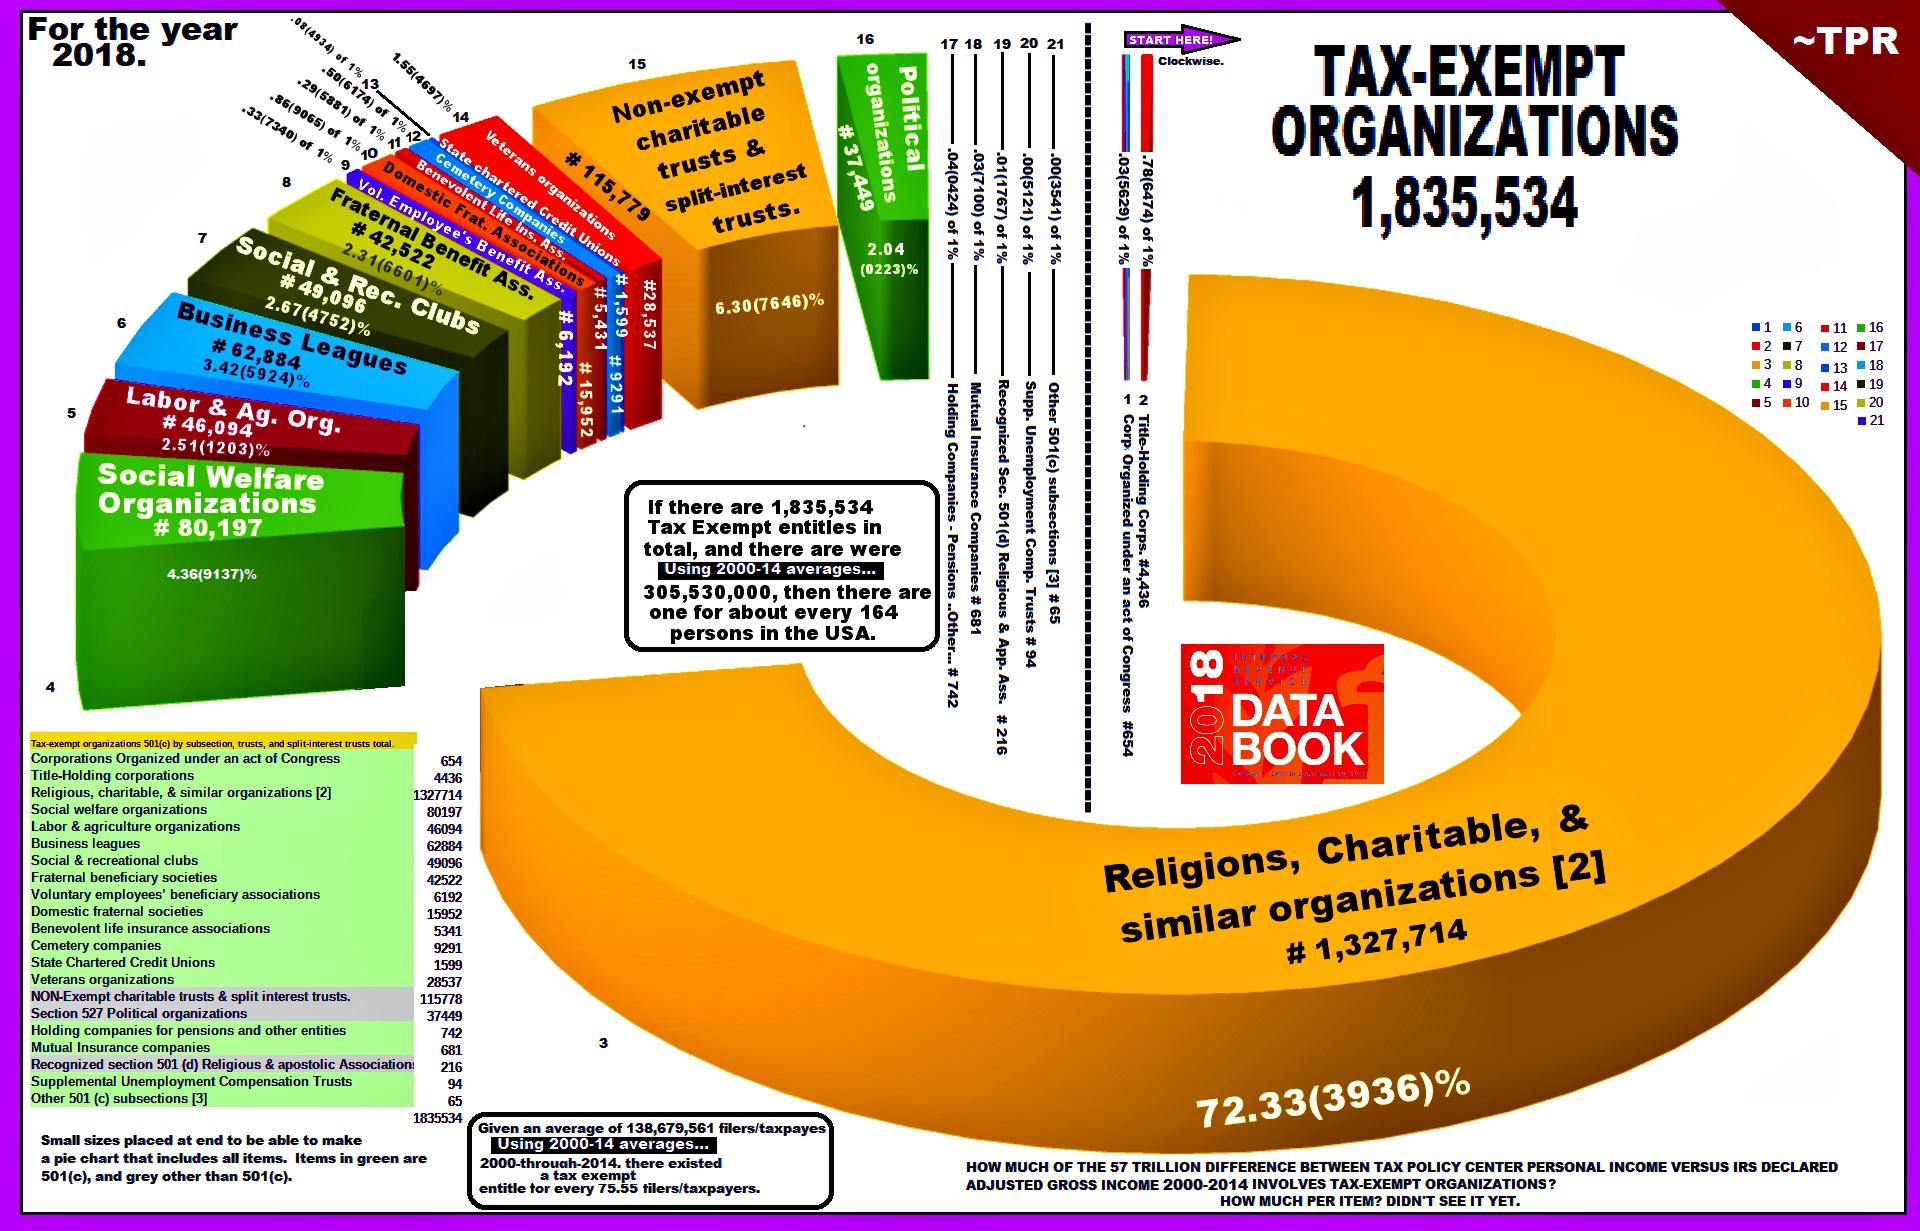
  • TAX EXEMPT 2
    TAX EXEMPT 2
    0 Comentários 0 Compartilhamentos 1K Visualizações
Mais Stories