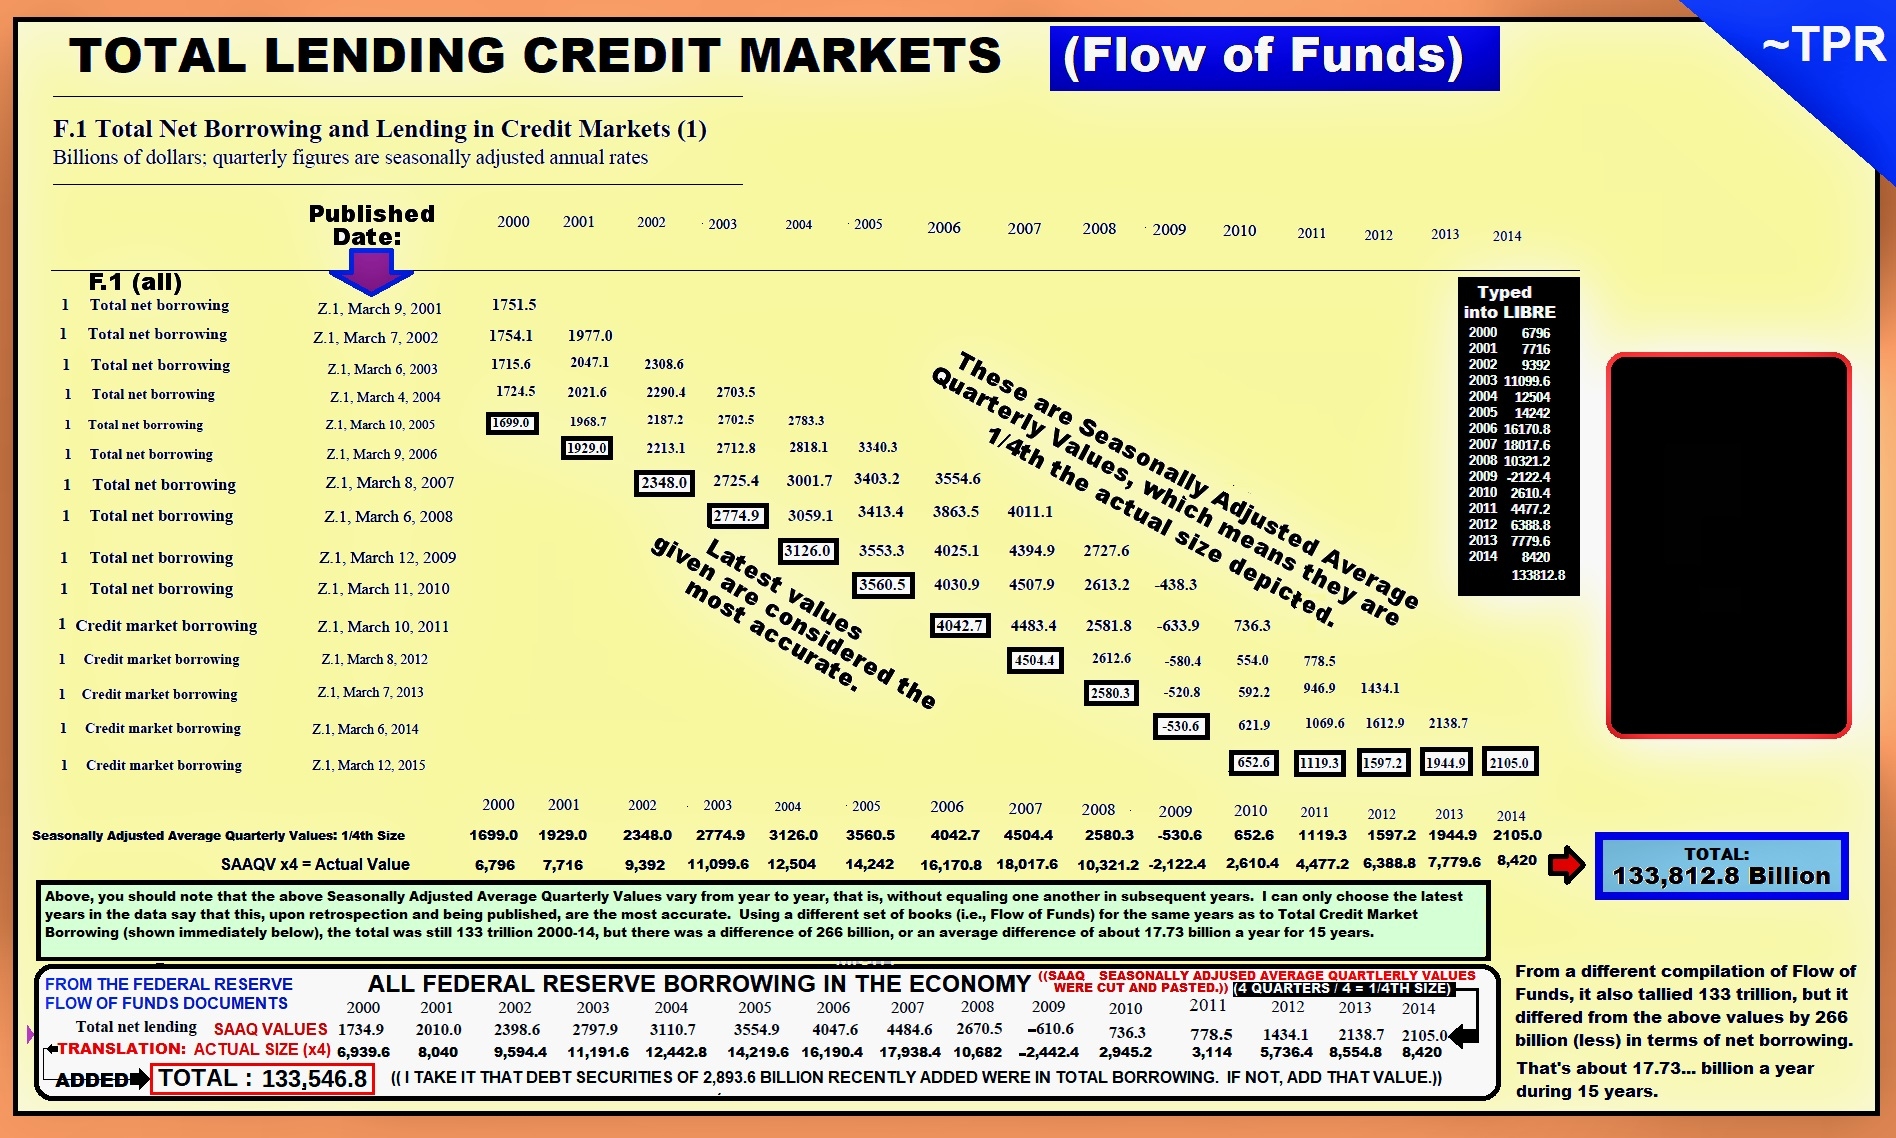
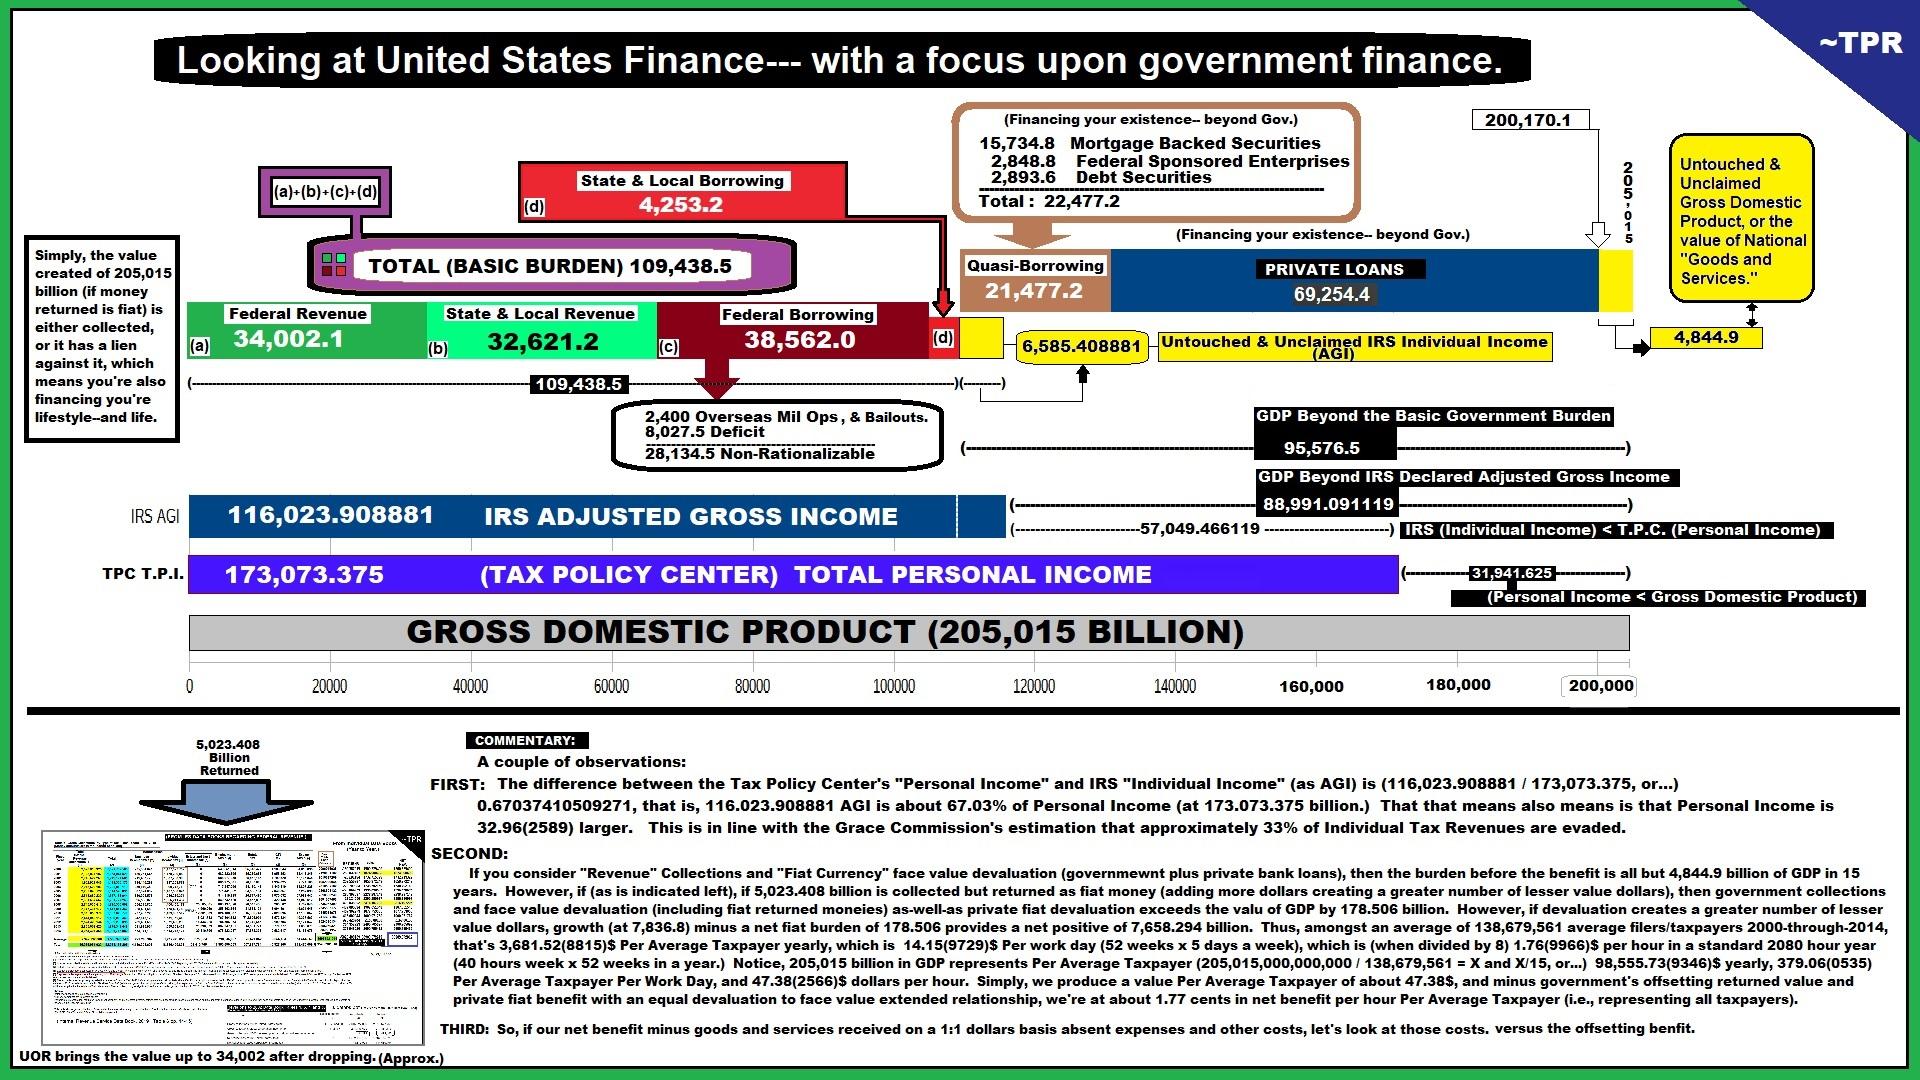
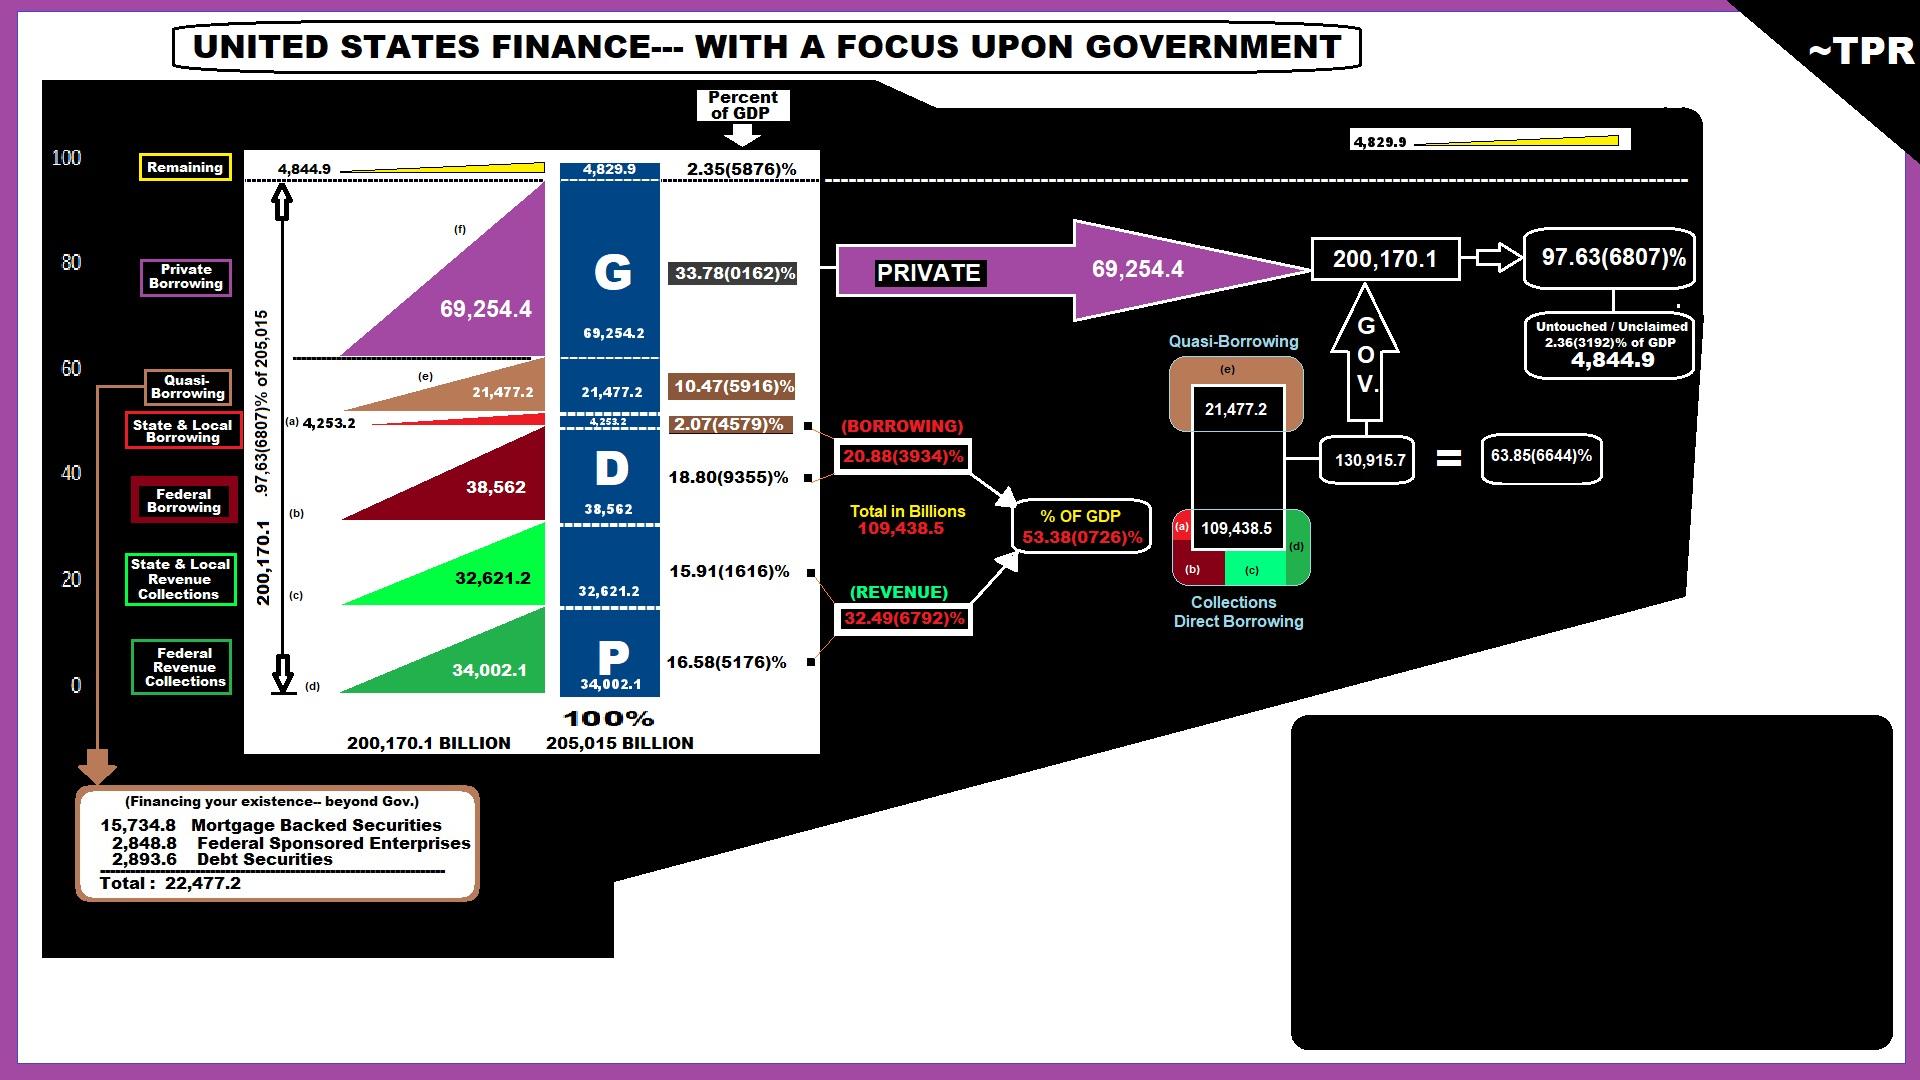
Notice: Between the years 2000-14, total net borrowing, which is to day new debt (absent any type of forgiveness) is over 133 trillion. However, officially declared IRS Adjusted Gross Income was approximately 116 trillion. Even if you subtract growth in the economy from face value devaluation from such said loans, you end up with NO OVERALL SAVINGS, for there is a lien against all IRS declared income. I consider CAPITALISM to engender savings invested/reinvested absent a third party with their own interest/influence/concurrence in economic decisions. In net terms, we do not have savings and thus Capitalism in America 2000-14. I'd guess the pattern hasn't changed.
Notice: Between the years 2000-14, total net borrowing, which is to day new debt (absent any type of forgiveness) is over 133 trillion. However, officially declared IRS Adjusted Gross Income was approximately 116 trillion. Even if you subtract growth in the economy from face value devaluation from such said loans, you end up with NO OVERALL SAVINGS, for there is a lien against all IRS declared income. I consider CAPITALISM to engender savings invested/reinvested absent a third party with their own interest/influence/concurrence in economic decisions. In net terms, we do not have savings and thus Capitalism in America 2000-14. I'd guess the pattern hasn't changed.